I am reading your other comments in the article and I read "I only kept it to 48kHz sampling, but you can see what happens at 21kHz." What do you mean by that?
When is Hi-Res not really Hi-Res?
- Thread starter Kippyy
- Start date
You are using an out of date browser. It may not display this or other websites correctly.
You should upgrade or use an alternative browser.
You should upgrade or use an alternative browser.
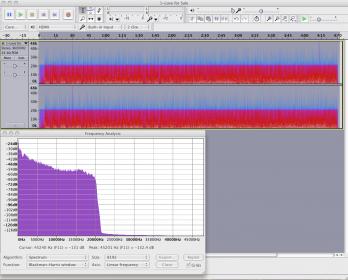
And as far as I can tell, there is no normalization. Audacity simply chops off the top but the scale is still down to -90db or so. I suspect its FFT has 16 bit resolution and hence can't go below.

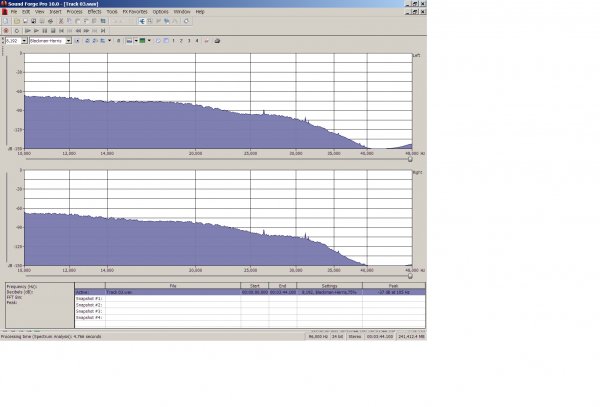
Notice how Audition shows the same initial peak at -36db but keeps going to -120+. And notice how different the two pictures are. Audacity makes you think all is gone after certain point where as Audition keeps going.

Notice how Audition shows the same initial peak at -36db but keeps going to -120+. And notice how different the two pictures are. Audacity makes you think all is gone after certain point where as Audition keeps going.
Notice how Audition shows the same initial peak at -36db but keeps going to -120+. And notice how different the two pictures are. Audacity makes you think all is gone after certain point where as Audition keeps going.
OK, but is it anything apart from noise? The part with a gradually increasing slope between ~27kHz and 48kHz is unlikely to be audio, so the noise cutoff, generously, looks to be at -120dB, which is consistent with the plot on the left, (if you were to fit a monotonically decreasing line to the spectrum, it would intersect the x-axis at about 27kHz). In other words, I think both plots show the same signal.
Also, this doesn't account for (a) the shape of the curve, as you noted, and (b) why Audacity appears to get the "positive control" right under otherwise identical conditions.
Can I send you a copy of the file and have you take a look at it?
Last edited:
I am reading your other comments in the article and I read "I only kept it to 48kHz sampling, but you can see what happens at 21kHz." What do you mean by that?
If you go down a bit further, I found the original 96kHz file of Lush Life, and posted that, which I also posted in this thread (i.e., the negative control).
Yes, there is still more to be figured out. Do you have a link to the track for me to buy? Or do you have to buy the whole album?
Thanks for the offer but I can't accept it.  Can you provide a link to the album so that I don't buy the wrong thing?
Here is the link: https://www.hdtracks.com/index.php?file=catalogdetail&valbum_code=HD603497941063

Here is the md5sum of the first file: 5996f6362ff175042a776040fe8a9a14 1-Love for Sale.flac
Here is a 20% off promo code:
20offHDtracks08

Here is the md5sum of the first file: 5996f6362ff175042a776040fe8a9a14 1-Love for Sale.flac
Here is a 20% off promo code:
20offHDtracks08
A quick play with Audacity 1.3.13: if file is 16 bit then you get -90dB range on plot; if file is 24 bit then y-axis extends to -120dB. So the program autoranges depending on source file.
Frank
Frank
A quick play with Audacity 1.3.13: if file is 16 bit then you get -90dB range on plot; if file is 24 bit then y-axis extends to -120dB. So the program autoranges depending on source file.
Frank
The reason I go down to -150dB is because 24-bit goes down to -144dB
The TH file in question was done by us for HDtracks. The FFT I posted is from the very first track "Love for Sale".
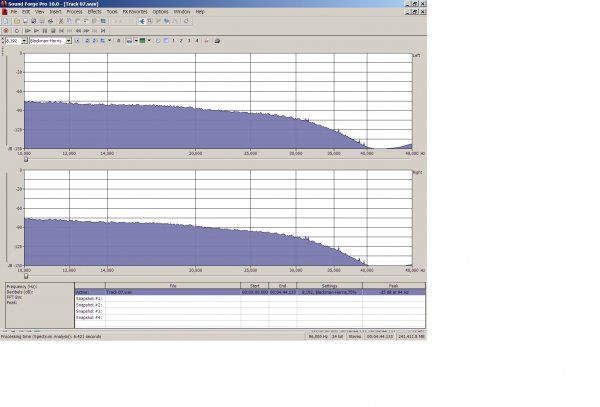
Here is Track 03 and Track 07
Attachments
It doesn't do that for me. I showed that graphic with identical 24-bit/96 Khz file. It acknowledges the same on the main display but still clips in FFT.A quick play with Audacity 1.3.13: if file is 16 bit then you get -90dB range on plot; if file is 24 bit then y-axis extends to -120dB. So the program autoranges depending on source file.
Frank
So even if we forget about the different baselines, there is something qualitatively different between the shapes of the curves you are displaying and the ones I am finding, unlike all the tracks from Remain in Light, which look absolutely fine, and qualitatively very similar to what you are posting.
Is it possible HDtracks is selling the wrong files, or they did something wrong in the wav to flac conversion?
Again, I am happy to provide one of the files on a password-protected server so you guys can compare this.
If by chance HDtracks is selling the wrong files, I would be very grateful for the opportunity to get what I paid for.
Attachments
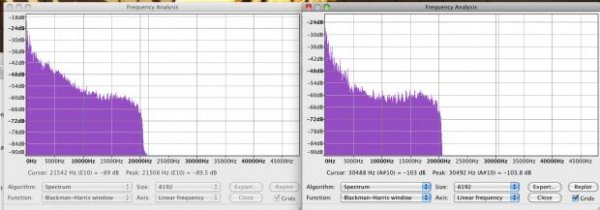
OK. A bit more of a play, and this demonstrated that the program truly auto-ranges in every situation: if you even change the size or function the y scale alters. This implies that the program has decided that there is no true detail to be shown below a certain level and indicates such by truncating beyond that point ...
Frank
Frank
Well, I need to go to bed. I suspect the files I have aren't the same as what Bruce has. In addition to the different shaped curves, his top out at -70dB, which seems to be about the mid-point for mine.
To test this, I converted the first track to wav using XLD. Since wav has no metadata, it should have the same checksum as the file Bruce has if it has the same music content. Here are my results:
To test this, I converted the first track to wav using XLD. Since wav has no metadata, it should have the same checksum as the file Bruce has if it has the same music content. Here are my results:
Code:
zsh-% md5sum 1-Love\ for\ Sale.wav
1381a3693fa2cc5828bbb83e3fb7467e  1-Love for Sale.wav

zsh-% ls -lh 1-Love\ for\ Sale.*
-rw-r--r--  1 wgscott  staff    98M Sep  1 19:00 1-Love for Sale.flac
-rw-r--r-- 1 wgscott staff 149M Sep 1 22:44 1-Love for Sale.wavI bought the album. Looks like there may be an issue here. Please stand by as I do more testing and cross referencing.
Wg, I am going broke buying music to test so that one would have to wait  .
.
Meanwhile, there is investigation going on to see what is wrong with the other album.
For now, let me curse something else: the HD Tracks download manager. Yes, it makes the job of downloading files easy. But here I am a day later wondering why my CPU load is so high. The machine was using some 30% doing nothing. A quick look at the performance manager shows that it was the download manager taking up all that space, doing absolutely nothing, having finished its work last night! So be sure to not let it sit round after you are done downloading.
The TH file in question was done by us for HDtracks. The FFT I posted is from the very first track "Love for Sale".
I've managed to figure out how to generate the analogous plot in Audacity with a -144dB baseline, as shown below. As you can see, the 22kHz step function becomes even more pronounced. Is it possible HDtracks is selling something other than what you provided? I would be more than happy to provide the files if you want to check to see if they are the same.

Link to full-sized image
Link to a positive control: Talking Heads: Remain in Light Track 01
obtained under identical settings, thus absolving
Audacity of alleged data misrepresentation.
Last edited:
Similar threads
- Replies
- 3
- Views
- 431
- Replies
- 0
- Views
- 2K
- Replies
- 240
- Views
- 14K
- Replies
- 17
- Views
- 3K
- Replies
- 107
- Views
- 12K
| Steve Williams Site Founder | Site Owner | Administrator | Ron Resnick Site Owner | Administrator | Julian (The Fixer) Website Build | Marketing Managersing |


