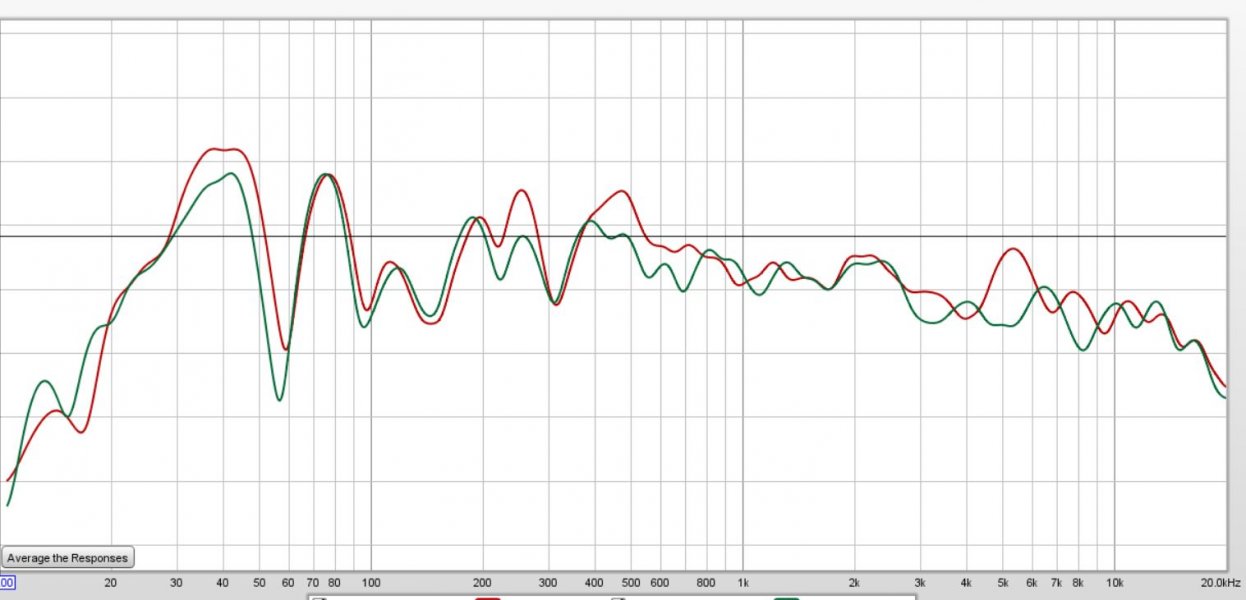
I did some measuring today just so I can see if I am see what I hear on the measurements. The following are frequency sweeps on Devore Gibbon X speakers using a Pass Lab X150.8 SS Class AB vs an Audion Super Sterling KT120 Single Ended Pentode amps.
24 wpc Audion Super Sterling Single Ended Pentode KT120 tube (red) and a Pass Labs X150.8 Class AB amps (green). The test gain was leveled. Note how the tiny little Audion produced more low end at 85db average SPL. The mid has a similar 3db bump while the high has an 8 db bump (using the bright EH 6922), which may be producing the sweetness and sparkle I like. It is quite is notable on the chart.

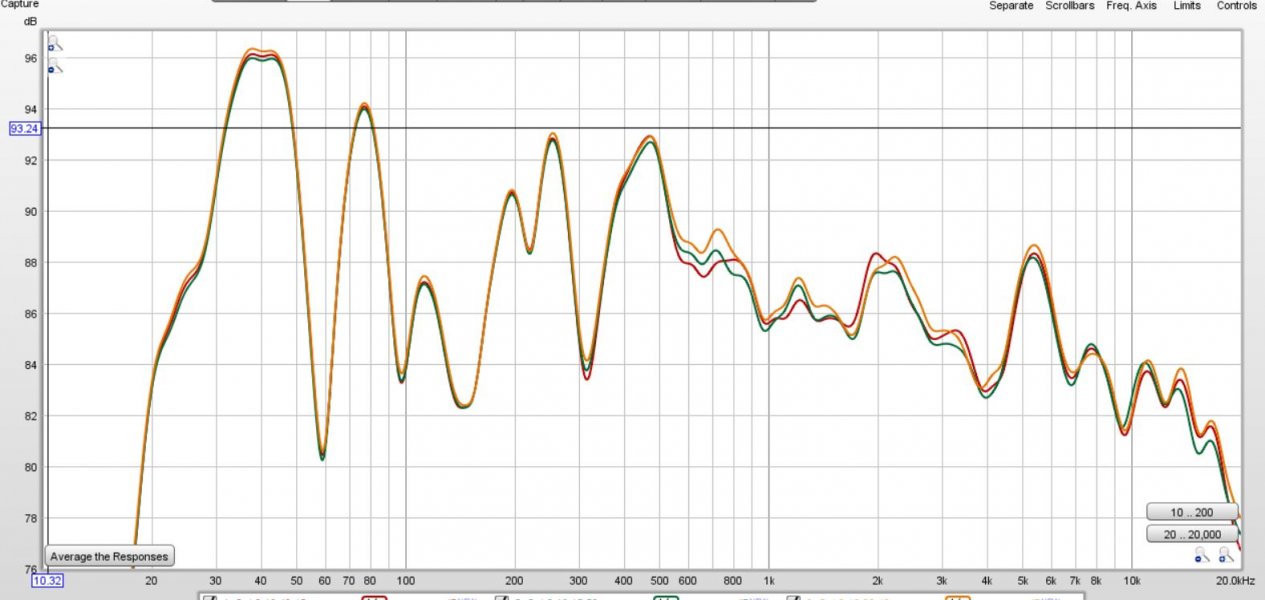
Level matched tube rolling 6H23N-EB (orange) vs NOS Amperex Bugle Boy 6DJ8 (red) vs EH 6922 tubes on an Audion Super Sterling KT120 amp, with the Gibbon X. Theyre all very close with 6H23N having the highest peaks. I didnt expect that as the EH sounded more sparkly, almost bright. My impression of the 6DJ8 was that it had more low end, but the chart doesnt show it. It is the dullest in the highs, for lack of a better word. It wasnt dull though just more low end. BTW, the sweep is done in my living room. The response is representative of real room with furniture including a huge sectional couch. It is not reflective of the Gibbon's true response curve, just the one in my room.

24 wpc Audion Super Sterling Single Ended Pentode KT120 tube (red) and a Pass Labs X150.8 Class AB amps (green). The test gain was leveled. Note how the tiny little Audion produced more low end at 85db average SPL. The mid has a similar 3db bump while the high has an 8 db bump (using the bright EH 6922), which may be producing the sweetness and sparkle I like. It is quite is notable on the chart.

Level matched tube rolling 6H23N-EB (orange) vs NOS Amperex Bugle Boy 6DJ8 (red) vs EH 6922 tubes on an Audion Super Sterling KT120 amp, with the Gibbon X. Theyre all very close with 6H23N having the highest peaks. I didnt expect that as the EH sounded more sparkly, almost bright. My impression of the 6DJ8 was that it had more low end, but the chart doesnt show it. It is the dullest in the highs, for lack of a better word. It wasnt dull though just more low end. BTW, the sweep is done in my living room. The response is representative of real room with furniture including a huge sectional couch. It is not reflective of the Gibbon's true response curve, just the one in my room.


