Measuring timing

Do you hear a difference after changing one element of digital playback

  • When Playback software (bt perfect) changed?

    Votes: 2 66.7%
  • When USB to SPDIF converter changed?

    Votes: 2 66.7%
  • Can you identify this difference in a blind test?

    Votes: 3 100.0%
  • No, I can't hear any difference & I have tried the above changes?

    Votes: 0 0.0%

  • Total voters
    3

jkeny

Industry Expert, Member Sponsor
Feb 9, 2012
3,374
42
383
Ireland
This is an adjunct to the "measurements & the stereo Illusion" thread that I had started but I decided to start afresh on this one so that, it doesn't get lost in the other thread & ignored by viewers.

What I'm hoping to do is tease out (with your help) the use of Jim LeSurf's IQtest tool in analysing some timing delays that are introduced in the audio playback chain by various parts of the chain including but not confined to:
- playback software
- electronic devices in the chain

Establishing these timing differences exist in the first place is a controversial subject & so I hope that we can calmly look at the evidence & evaluate it's significance. Let's not settle in to bunkers before we even start, OK?

Secondly, I would like to analyse what significance this has to our listening through looking at the possible psychoacoustic significance of whatever we uncover

Thirdly, I'm hoping that those interested will download the programs so that they can do these tests themselves & hopefully, extend & tease out some issues. There may be some C programmers who can check out the program's routines & ensure that it is working as intended & possibly make some changes.

So, if there is any interest, let's start!
 

Groucho

New Member
Aug 18, 2012
680
3
0
UK
A very neat way to test timing issues. However, the results are open to interpretation. In the results for the DACMagic, LeSurf concludes:

The above said, we should take care not to put the blame on the DACMagic for the higher replay rate flutter when using a direct USB connection. The root of the problem here is that a normal domestic computer tends to keep being ‘distracted’ by having a number of under-the-hood activities to perform. It also probably has a computer clock whose clock rate isn’t ideal as a basis for 44·1k or 48k operations. Audio is very demanding in terms of the final output needing to be clocked in a very uniform and regular manner. So the unwanted ‘jumps’ here are likely to be due to things going on inside the computer system that get in the way of maintaining a carefully regulated flow of audio data to the DAC. For this reason the details of the flutter can be expected to vary from one domestic computer setup to another. And may also change if you alter what software is running or do something as innocuous as connect or disconnect some other device from the USB ports.

I would have said that what he observes has nothing to do with problems in the computer, and has everything to do with the very concept of isochronous USB i.e. the DAC has its own internal clock and it has to maintain a playback rate synchronised on average with the incoming data rate. Possibly in this particular DAC's implementation, it adjusts its playback rate with some minimum step size, and because the two clocks are at a more-or-less fixed ratio, this adjustment will occur at a regular interval. I would suggest that it has nothing to do with what the PC is doing, and it is this sort of statement that gives digital audio a bad name, suggesting that the output of the DAC is directly influenced by the PC's workload etc. This is similar to those people who, to this day, believe that the data streams from a CD in 'real time' like a vinyl LP, and that therefore they need an expensive CD transport that resembles a turntable.
 

jkeny

Industry Expert, Member Sponsor
Feb 9, 2012
3,374
42
383
Ireland
Jim LeSurf introduced a very clever technique for measuring very small timing differences in the playback channel - down to parts per billion (nanoseconds). His write up, examples of it's use, source code, etc are all here - best to start at this page http://www.audiomisc.co.uk/Linux/Sound3/TimeForChange.html

You can read up on the technique he uses & to check it's validity. Any objections to the veracity of the techniques in revealing timing differences would be welcome at this stage before going down the road too far & wasting time.

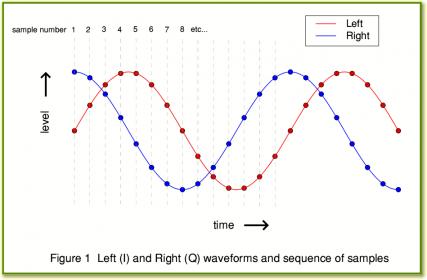
Essentially he generates a file (using the WAV_IQ_generator program)which is used as the input file to the playback chain & the analogue outputs recorded & analysed/graphed by another program IQ_FFT_scan. The input file consists of different signals being generated on each channel that have a very precise mathematical relationship between them - the left channel (The I channel) has a sinewave signal on it & the right channel (the Q channel) has a cosine signal on it. There is therefore a precise phase relationship between each sample pair in the waveform. This particular waveform runs for 14 samples for reasons explained in the text
FigIQ1.jpg

Here's what he says about it & where the concept derives from http://www.audiomisc.co.uk/Linux/Sound3/TheIQTest.html
For a waveform whose frequency also varies with time we can use this approach to measure the effective frequency during any short portion of time. Thus it gives us a way both to determine the overall value averaged over a long time (thus finding out if the system is playing consistently ‘slow’ or ‘fast’), and to detect how the frequency may alter as time passes. To do this we need to be able to determine the phase at each instant of interest.

A practical snag with single channel (i.e. mono) signals is that we need to examine the waveform over a duration long enough to be able to identify which portion of the sinusoid we have, and thus which phase it will have for any instant. However IQ modulation and demodulation (as widely used in modern communications) provides an easier approach. This is based on having two waveforms transmitted in parallel. These share the same frequency and amplitude. But they differ in phase by ninety degrees. We then say one of these is the ‘In Phase’ component (I) and the other is the ‘Quadrature’ component (Q) of this composite IQ waveform. This approach has a number of convenient mathematical features that make determining the phase much simpler.

He has done a few measurements with this tool - measuring the Halide Bridge USB converter & comparing it to a DACMagic's USB input http://www.audiomisc.co.uk/Linux/Sound3/TimeForChange.html

Measuring the Arcam rDacs output http://www.audiomisc.co.uk/Linux/Sound4/rdac.html

What I am particularly interested in is in it's use for also measuring the timing delays that occur in our audio playback chain & what significance these measurements might have. I'm also interested in the possible use of the tool to characterise devices form this particular aspect of timing. A useful paper about Temporal Coherence will be found here http://ip565bfb2a.direct-adsl.nl/articles/vmaanen-files/temporal-decay.pdf and this paper which establishes 5 microseconds as the lower limit of audibility in human hearing.

What I'm hoping to show is the timing delays at every stage in the audio playback & it's cumulative effect before it reaches the speakers

We already agreed in the other thread that the speakers are the worst offenders in this regard & the room probably the next worst offender in messing up the signal timing & the point was made that the scale of the timing delays in these two factors would swamp any delays in the electronics. My logic tells me that this may not be correct as timing delays are additive so even if there are millisecond delays in speakers & room adding variable (tens/hundreds) microsecond delays on top of this will be audible. Remember we are talking about room & speakers & therefore their timing delays being fixed but in changing the playback software or changing some of the playback devices we are introducing a additional change in the timing (not a fixed time delay across all frequencies but a time delay that varies with frequency).

However, if this is a sticking point then there is no point in wasting time going any further with this. Can we reach a consensus on this?
 
Last edited:

jkeny

Industry Expert, Member Sponsor
Feb 9, 2012
3,374
42
383
Ireland
A very neat way to test timing issues. However, the results are open to interpretation. In the results for the DACMagic, LeSurf concludes:

I would have said that what he observes has nothing to do with problems in the computer, and has everything to do with the very concept of isochronous USB i.e. the DAC has its own internal clock and it has to maintain a playback rate synchronised on average with the incoming data rate. Its playback rate has to be adjusted with some minimum step size, and because the two clocks are at a more-or-less fixed ratio, this adjustment will occur at a regular interval. I would suggest that it has nothing to do with what the PC is doing, and it is this sort of statement that gives digital audio a bad name, suggesting that the output of the DAC is directly influenced by the PC's workload etc. This is similar to those people who, to this day, believe that the data streams from a CD in 'real time' like a vinyl LP, and that therefore they need an expensive CD transport that resembles a turntable.

I agree with your main point in the post - that the glitch on the DACMagic graph is the result of the USB protocol & the re-synching of the clocks. But let's not throw the baby out with the bathwater. The technique shows it's usefulness in revealing such a difference even if the analysis of where that difference came from is flawed. So why not use the tool to analyse other possible timing differences & see what we come up with?
 

Groucho

New Member
Aug 18, 2012
680
3
0
UK
I agree with your main point in the post - that the glitch on the DACMagic graph is the result of the USB protocol & the re-synching of the clocks. But let's not throw the baby out with the bathwater. The technique shows it's usefulness in revealing such a difference even if the analysis of where that difference came from is flawed. So why not use the tool to analyse other possible timing differences & see what we come up with?

I agree it's a very neat test for measuring a very specific parameter. Maybe not that useful for the whole audio chain, though. (What I was saying about the DACMagic results is perhaps more relevant to the JPlay thread: i.e. that studying the design of a system can help in understanding what (if anything) is wrong with it, what improvements are possible, and what aren't, rather than speculating based on some superstitious notion of how the system works.)

On the point of accumulated delays, it doesn't matter if the overall delay is ten seconds, as long as that delay is constant, and the same for both channels. On the other hand, phase shifts, noise and distortion will mess up the signal and the relationship between left and right. Elimination of these is more important than delays, I would suggest. I don't think LeSurf's test is useful on these issues..?

The users of DSP-based active speakers, it seems to me, are the only people who actually do anything about eliminating these factors. By measuring delays and phase shift and correcting them, in order to get as close to an impulse in -> impulse out as possible, they effectively remove the accumulated phase shifts and delays from the whole system. They also reduce distortion by using separate amps for the drivers. In other words, they don't debate what is audible and what isn't, they just eliminate the issue and forget about it!
 

jkeny

Industry Expert, Member Sponsor
Feb 9, 2012
3,374
42
383
Ireland
I agree it's a very neat test for measuring a very specific parameter. Maybe not that useful for the whole audio chain, though. (What I was saying about the DACMagic results is perhaps more relevant to the JPlay thread: i.e. that studying the design of a system can help in understanding what (if anything) is wrong with it, what improvements are possible, and what aren't, rather than speculating based on some superstitious notion of how the system works.)
Indeed, but we might get to that in the plots if the thread gets that far - the timing differences that result from different software playback

On the point of accumulated delays, it doesn't matter if the overall delay is ten seconds, as long as that delay is constant, and the same for both channels.
This test is measuring the timing differences between both channels & you will see from the results that it's not a constant delay but varies with frequency
On the other hand, phase shifts, noise and distortion will mess up the signal and the relationship between left and right. Elimination of these is more important than delays, I would suggest. I don't think LeSurf's test is useful on these issues..?
If that is the general consensus, I'll not continue with this thread any longer as it would just be a waste of my time. Can we try to sort out this point before I continue too far, please?

Edit:In other words, do people believe that whatever microsecond differences are found between different playback software or different digital audio sources, it will be of no consequence to our listening? I really consider this the most crucial first hurdle

The users of DSP-based active speakers, it seems to me, are the only people who actually do anything about eliminating these factors. By measuring delays and phase shift and correcting them, in order to get as close to an impulse in -> impulse out as possible, they effectively remove the accumulated phase shifts and delays from the whole system. They also reduce distortion by using separate amps for the drivers. In other words, they don't debate what is audible and what isn't, they just eliminate the issue and forget about it!
Yes, but I guess this IQtest is a different view into our playback systems & I'm willing to produce some evidence of what I believe are phase shifts in the playback software & electronics if there is interest & consensus that it's of value, otherwise I won't bother
 
Last edited:

jkeny

Industry Expert, Member Sponsor
Feb 9, 2012
3,374
42
383
Ireland
The first thing I did when I got this tool working was to do a sanity check. I used the WAV_gen program to generate an input file with 14 samples in it's cycle & 16bits 44.1KHz @ -3B down from max volume. Now this would normally be put through s playback chain & the analogue output recorded for analysis in the FFT program. I bypassed the whole playback chain & used this file as my pretend captured file for analysis in the FFT_scan program. The results should be perfect i.e. no time delays. I had to generate a file of at least 163 seconds length (as this is what is required to do the LF analysis in the FFT program) so I generated a file 180 secs long i.e it repeats the 14 sample signal waveform for 180 secs.

Here are the 3 graphs that are produced from that program & a bit of discussion:

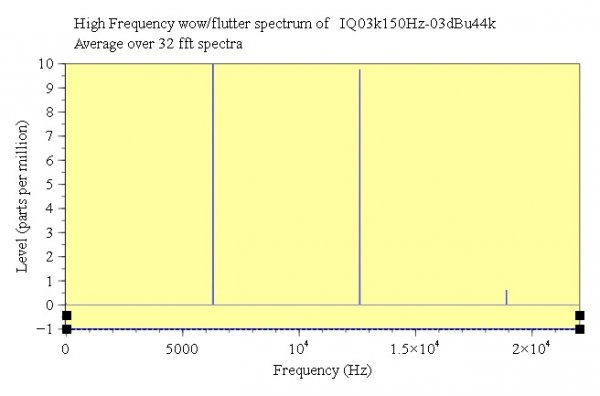
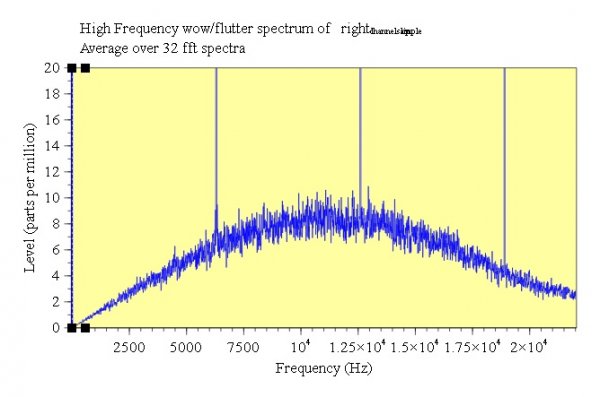
HF plot.jpg
The above plot shows Time slippage between L & R channel in microseconds (parts per million) Vs High Frequency graph (0 - 22KHz) Vs . This should be a flat line for this generated file. What we see is a flat line with a spike at 6.3KHz & 12.6KHz which puzzled me. There is a clue to what is going on here - the generated file has 14 samples per cycle which for 44.1KHz sample rate is 3.15KHz (6.3Khz & 12.6Khz being multiples of this) - so there may be some end of cycle condition or end of file condition that the FFT program doesn't analyse properly - that gives these spikes. It would be good to find the problem & resolve it but they can be ignored in the plots of real measurements that follow. Jiim doesn't give much attention to the HF area (he focuses more on the LF plots) but I think this is where a lot of the action is?
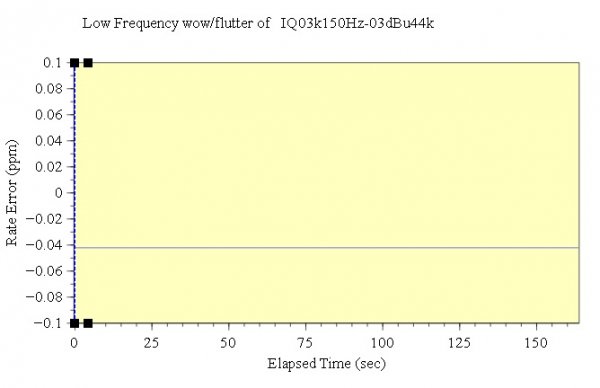
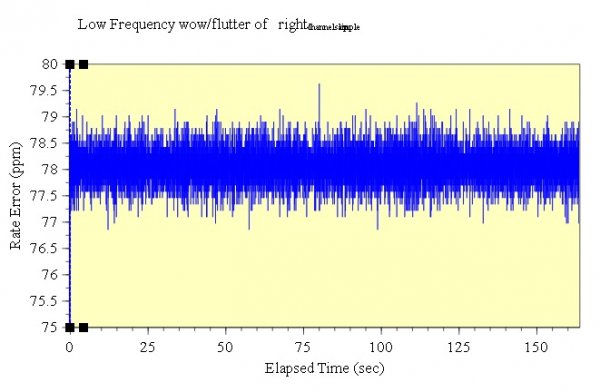
LF Vs Time.jpg
The above plot is Rate error Vs Time - a different view than the next plot Time differences Vs Frequency. This plot should also be a flat line at the origin. I see an anomaly here in that it is a flat line but NOT at the origin - I have no explanation for this. Any ideas?
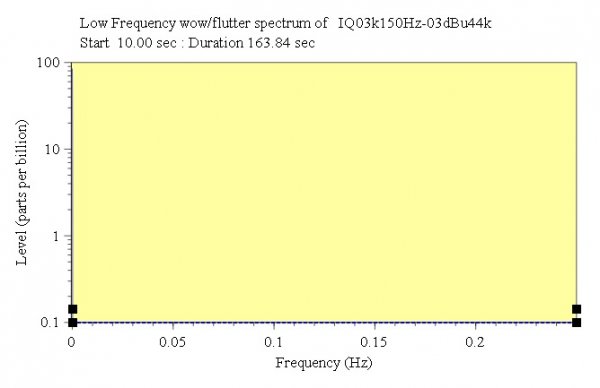
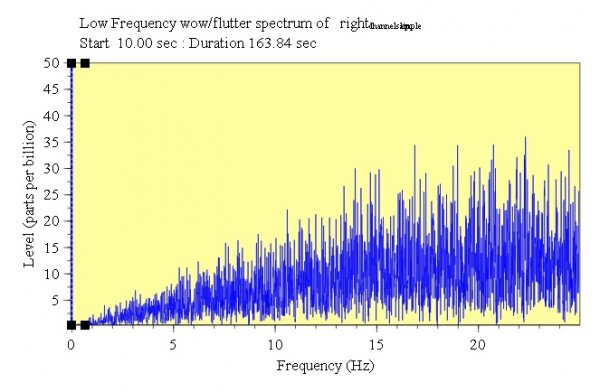
LF Vs Freq.jpg
The final plot is of the LF portion of the spectrum. There is no line on this graph to be found.

Just a note - there is a scientific plotting program, Veusz, used to plot these results. It is pretty versatile & so one can zoom in or out, adjust the scale of the X & Y axes, etc.

Hope this gives some feel for how to read the plots & what the issues are? Next I will show plots for known timing delays
 

Groucho

New Member
Aug 18, 2012
680
3
0
UK
Good stuff. Can you see any anomalies in the raw analysis data? (Should all be constant-ish values?)
 

jkeny

Industry Expert, Member Sponsor
Feb 9, 2012
3,374
42
383
Ireland
Good stuff. Can you see any anomalies in the raw analysis data? (Should all be constant-ish values?)
No anomalies that I can see in the waveform when I bring it into Audacity but there could easily be a sample missing at the end of a 14 sample cycle which I maybe wouldn't spot as Audacity joins up sample to sample with a continuous line. I suspect this is the area to look at to explain those glitches at 6.3KHz & 12.6Khz (you will also see them occurring on other real world plots but also at other multiples of 3.15KHz & at 3.15Khz itself).

The other possibility for the glitches are the length of the file I generated & the fact that it probably isn't ending exactly on a 14 cycle ending. This is something that just occurred to me now - so it's good to talk :)

Edit: Only way I can do this accurately is by using Audacity again to cut off the ending so that it falls exactly on the end of 14 sample cycle
 

jkeny

Industry Expert, Member Sponsor
Feb 9, 2012
3,374
42
383
Ireland
The final plots for the moment until we get into test results of real playback software & real digital interface devices.

So the next test I did was introducing a known delay in the signal to see how this appears in the plots. The only tool I have for this is Audacity (some of you ma have better tools?) What I did was opened my generated file in Audacity, split it into stereo channels & time shifted the L channel by the smallest amount it would allow - this turns out to be 1 sample or about 22uS (microseconds). I then loped off the first & last sample from the resultant file so that there was no situation where one channel had no sample in it. And saved the file. I then used this file to run the FFT analysis on.

Here are the resultant plots. Be careful with the Y axis scale - it may not be the same as the original plots - I have optimised the scale for best visibility. Also be aware that the first two plots Y-axis is in microseconds (ppm) while the last (LF Time Vs Freq) is always in nanoseconds (ppb)

I hope that maybe we can work out how to interpret these results? Jim is focussed on other areas & doesn't really have the time to look at this.

The first area that should be discussed is the second graph where it shows the time slippage against time. As I slipped the input file by 1 sample in the L channel, I would have expected this to show a constant slip of about 22microseconds - instead we see a rate error with a baseline of 78 microseconds. Any ideas? (Just a note - I did another file with 2 sample L channel shift & it plots this at double this at 156 uS - so there is consistency here)

HF plot:
HF 1 sample slip.jpg

LF Vs Time plot
LF Timing 1 sample.jpg

LF Vs Freq plot
LF Freq 1 sample.jpg
 

jkeny

Industry Expert, Member Sponsor
Feb 9, 2012
3,374
42
383
Ireland
One final preliminary note - the software for these programs can be found here http://www.audiomisc.co.uk/software/index.html
You only need:
WAV_IQGen (RO) / WAV_IQ_Generator (ROX) These applications allow you to generate an output LPCM Wave file containing an ‘IQ’ waveform for performing an IQ Test on a system and determine its timing behaviour.

WAV_IQ_FFT (RO) / WAV_IQ_FFTScan (ROX Linux) These applications carry out a detailed analysis of an IQ waveform LPCM Wave file. If you record the output of a system playing an IQ test file then these applications let you assess the timing details of the playback and detect variations in playing rate. The result is a sort of modern “wow and flutter” measurement, but with a very high sensitivity that can detect rate variations of the order of a part per billion!

If you have a Linux/Unix system (maybe it's a particular variant of Linux RISC OS Linux ROX?) you can just compile these C programs & run them. If you only have a Windows system you need to do some source changes to convert them to operate on Win OS - then compile & run.

In any case the source code can be read & analysed!

This is as far as I'm going to go for the moment as there is a lot to digest & I'm on holidays from Sunday so won't be continuing until I get back.

What the tool shows so far is that it gives consistent results for know timing differences - 2 sample slip is twice what is shown on 1 sample slip. Even if we can't, at the moment directly relate the plot value (78 uS) to the expected timing slip (22uS), the fact that there is a constant, repeatable difference between these shows that the tool is working - (it's just a calibration issue?).

So what I will be showing in the next plots when I return from hols - are the timing differences shown between different software playback & between different digital devices.

Oh & btw, neither the playback software nor hardware is broken, in case anyone is confused about this.
 

jkeny

Industry Expert, Member Sponsor
Feb 9, 2012
3,374
42
383
Ireland
I agree it's a very neat test for measuring a very specific parameter. Maybe not that useful for the whole audio chain, though.

As this might be a prevalent view - I wanted to draw attention again to the paper I linked to in my initial post but it is worth pointing it out again here http://ip565bfb2a.direct-adsl.nl/articles/vmaanen-files/temporal-decay.pdf
"TEMPORAL DECAY: A USEFUL TOOL FOR THE CHARACTERISATION OF
RESOLUTION OF AUDIO SYSTEMS?
Drs. H.R.E. van Maanen
TEMPORAL COHERENCE"

Some quotes
Any band-limited system has a "time-smear" in its impulse response. The
width of this impulse response is dependent on the bandwidth of the system
and of the way its band is limited. This spread results in masking of fine
details and the related "Temporal Decay" can vary from 0.16 to 1.09 dB/µs.
The concept will be discussed and some examples will illustrate the
results.
In other words, any audio system has the tendency to "smear out" the signal
both in amplitude and in time. These effects could reduce subjective
experiences like the "definition" and "transparency" of the perceived
sound. This smearing will always be a degradation of the original sound and
we will try to study its influence on the perceived sound.
We think that the "temporal decay" can be used to quantify the temporal
smearing by a simple characteristic value. It has units of dB/µsec. and in
words it is the inverse of the time (in µsec.) required for the envelope of
the impulse response to decay by 1 dB. For most analog filters it can be
- 2 -found directly from the time derivative of the envelope function, for
digital filters (which can show pre-ringing, see below) this is a bit more
complicated.
The temporal decay seems to be a useful "handle" to get grip on the
temporal behaviour of audio systems and to make a semi-quantitative
comparison. It is an excerpt of the impulse response of a system, which
tells more about a system than its frequency response between 20 Hz and 20
kHz.
High-end audio systems often sound better with analog recordings than with
digital ones. This is at first surprising because of the very high quality
specifications of digital systems. But the temporal decay is one of the few
points at which analog systems beat their digital counterparts and it is
thus a clear hint of its importance.
 

GaryProtein

VIP/Donor
Jul 25, 2012
2,542
31
385
NY
My flame suit is donned. :p

With expectation bias being so high in this hobby, the only way to say what we really hear [or not] is with a blind test.
 

Phelonious Ponk

New Member
Jun 30, 2010
8,677
23
0
My flame suit is donned. :p

With expectation bias being so high in this hobby, the only way to say what we really hear [or not] is with a blind test.

Yep. Sometimes this hobby is like watch collectors convincing themselves that their expensive timepieces aren't expensive because they're heavy, elegant and bejeweled, but because they keep better time than the clock in an iPhone. And it is already so full of inaudible monsters under the bed that I can't get too excited about the discovery of new anomolies until their audibility is verified by blind listening. Is that easy? Well, verifiable, statistically valid AB/X testing is not, simple blind listening is. If I were into finding problems, - a noble enough persuit, by the way - finding out whether or not I, at least, could hear them, blind, would be a very early step in the process. It wouldn't prove that they can't be heard, but it would give me a very strong indication of how worthy they are of further pursuit.

Can I borrow that suit?

Tim
 
Last edited:

microstrip

VIP/Donor
May 30, 2010
20,807
4,702
2,790
Portugal
This post was intentionally deleted.
 
Last edited:

Phelonious Ponk

New Member
Jun 30, 2010
8,677
23
0
Deleted, because the post I responded to and quoted was deleted.

Tim
 
Last edited:

jkeny

Industry Expert, Member Sponsor
Feb 9, 2012
3,374
42
383
Ireland
Ok, no interest in this topic it would seem - Sayonara!
 

amirm

Banned
Apr 2, 2010
15,813
38
0
Seattle, WA
Guys, the topic of the thread is "measuring timing." Please don't distract it with talk of double blind tests and such. They are different things and Jkenny is doing good work here. I wish I was not so busy and could contribute....
 

Phelonious Ponk

New Member
Jun 30, 2010
8,677
23
0
Guys, the topic of the thread is "measuring timing." Please don't distract it with talk of double blind tests and such. They are different things and Jkenny is doing good work here. I wish I was not so busy and could contribute....

Is it irrelevant? I guess I wish you had time to explain why. He has measured something; that is good. We're talking about audio. It seems like the next logical step is to determine whether or not what he has measured is audible, whether or not it needs to be studied further. Unless we've left the realm of practical engineering and entered pure research...

Tim
 

About us

  • What’s Best Forum is THE forum for high end audio, product reviews, advice and sharing experiences on the best of everything else. This is THE place where audiophiles and audio companies discuss vintage, contemporary and new audio products, music servers, music streamers, computer audio, digital-to-analog converters, turntables, phono stages, cartridges, reel-to-reel tape machines, speakers, headphones and tube and solid-state amplification. Founded in 2010 What’s Best Forum invites intelligent and courteous people of all interests and backgrounds to describe and discuss the best of everything. From beginners to life-long hobbyists to industry professionals, we enjoy learning about new things and meeting new people, and participating in spirited debates.

Quick Navigation

User Menu

Steve Williams
Site Founder | Site Owner | Administrator
Ron Resnick
Site Co-Owner | Administrator
Julian (The Fixer)
Website Build | Marketing Managersing