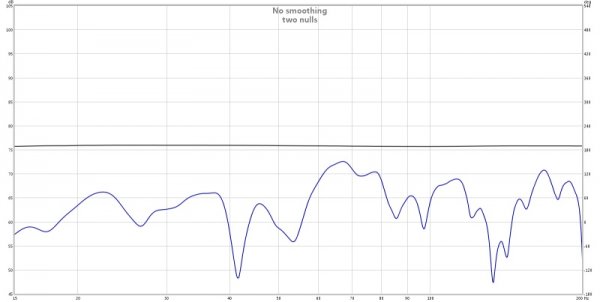
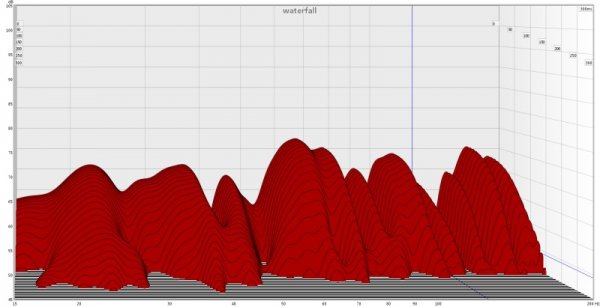
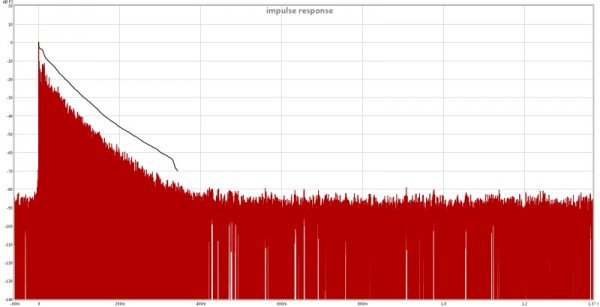
cancellation frequency = speed of sound / (2 * path length difference)and then how is this measured in the time domain so you can find the boundary?
How flat should the frequency response be in a room?
- Thread starter caesar
- Start date
You are using an out of date browser. It may not display this or other websites correctly.
You should upgrade or use an alternative browser.
You should upgrade or use an alternative browser.
cancellation frequency = speed of sound / (2 * path length difference)
I know that part.... what I'm asking is what graph would you use?
Last edited:
Here's the same graph with 1/3 per octave smoothing applied:
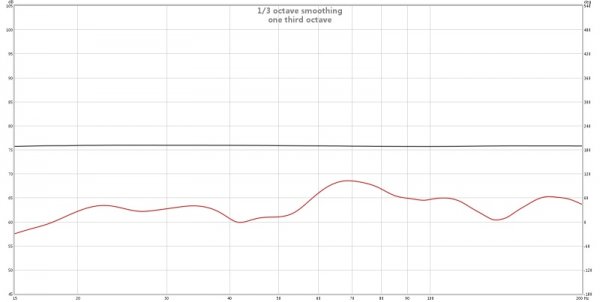
In that old seated position, without any treatment and no DSP applied, those nulls are audible.
By moving the seated position back slightly, applying some room treatment to the sidewalls in the high pressure zone and using DIRAC, bass sounds much improved.

In that old seated position, without any treatment and no DSP applied, those nulls are audible.
By moving the seated position back slightly, applying some room treatment to the sidewalls in the high pressure zone and using DIRAC, bass sounds much improved.
Last edited:
There was a graph I saw on a SIM system that was done in the time domain and you could see the reflections at different time points (like side walls, or ceiling/floor). All you have shown are freq. graphs.
For the purposes of determining/seeing the target curve, you want fair amount of filtering. 1/3 to 1/6 would be my choice. For the purposes of *analyzing* the low frequency response, then you use 1/12 or better. These are different things.
here's the same graph with phase as well. Is that what you are talking about? I am not sure what graph you are referring to or what time response you are talking about? Is it impulse or phase? You can do this with REW pretty easily. I am no expert on phase or impulse response. You can see that the phase is reversed sharply at the sidewall SBIR which is at approximately 130hz.There was a graph I saw on a SIM system that was done in the time domain and you could see the reflections at different time points (like side walls, or ceiling/floor). All you have shown are freq. graphs.
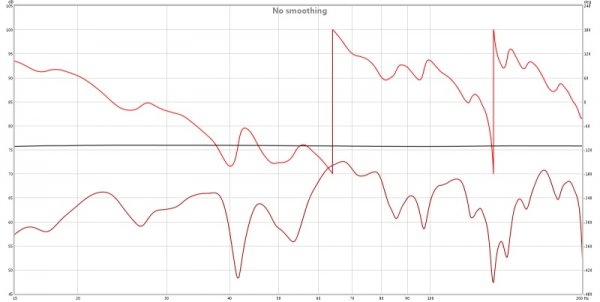
Last edited:
For the purposes of determining/seeing the target curve, you want fair amount of filtering. 1/3 to 1/6 would be my choice. For the purposes of *analyzing* the low frequency response, then you use 1/12 or better. These are different things.
I tried to tell it in post #12 ... I hope people believe you ...
No, he is talking about the impulse response shown over some number of milliseconds. Here is a sample image I have for another reason but gives you the picture of what you want to get REW to show you:here's the same graph with phase as well. Is that what you are talking about?

Ok this is from a single LP and that is a room node if i ever saw one!!! Do you think that same node would look so much different using no smoothing?
It looks like there's loss of energy between 65hz and 100hz.
The problem with smoothing even at 1/6 is that you can't really see whether there's a true boundary interference contributing to that loos of energy or something else. With unsmoothed, an SBIR dip will be very obvious. If an SBIR is really there, then you can use math to figure out which boundary is causing the SBIR.
Can you identify which frequency you are talking about?Ok this is from a single LP and that is a room node if i ever saw one!!! Do you think that same node would look so much different using no smoothing?
I showed unsmoothed simply to demonstrate how useless smoothing is dealing with LF problems. I showed you an example how easy it is to identify an genuine SBIR. Nulls and Modes are not the same thing.
What are you talking about? I assume you are talking about your graph. In that case, you need more info to determine whether that's a room mode.If my memory is right it is at 73hz.
This is where I become a subjectivist. I can't think of any good reason to put up with any more distortion, coloration, call it what you will, than you can avoid, in anything up to this point. Not in the source, the amp...if you don't have EQ engaged, how close your out put is relative to the input determines whether or not you have hifi, much less high end...MHO, YMMV. But once you hook up soeakers in a room, that ship has sailed. We are accustomed to listening in rooms. Most of what we hear is altered by the ambiance of rooms, and flat sounds wrong. What's right depends on our speakers, our listening rooms, our ears and our perceptions. EQ, DSP or otherwise, is your friend. Tweak slowly, conservatively, negatively. Read the charts and tweak toward a target if that helps, but understand that if you take it too far you'll end up adjusting your ears to the tweak as much as he other way around.
Tim
Tim
I would suggest it is time to re-read our great thread on Acoustic-Measurements-Understanding-Time-and-Frequency
http://www.whatsbestforum.com/showthread.php?8203-Acoustic-Measurements-Understanding-Time-and-Frequency
http://www.whatsbestforum.com/showthread.php?8203-Acoustic-Measurements-Understanding-Time-and-Frequency
This is the reason I said 1/6 smoothing you failed to show that one!!!
Here's the same graph with 1/3 per octave smoothing applied:
View attachment 13096
In that old seated position, without any treatment and no DSP applied, those nulls are audible.
By moving the seated position back slightly, applying some room treatment to the sidewalls in the high pressure zone and using DIRAC, bass sounds much improved.
Read my post 17. I don't mind whatever resolution works best for your room. I am just giving you useful info to help you more specifically identify lost energy potentially caused by boundary interference. I can't tell from your measurement whether that's an issue in your room. There are additional things you can do as well. For example, Nyal says there's an excess phase or group delay plot you can do in REW to identify LF late arrivals. I had to deal with this issue myself. I can tell you from my experience that finer LF resolution can very much help you identify the boundary location and appropriately treat it. More resolution can also tell you whether you could benefit from a different speaker or seated position and which direction to start moving. There's nothing to be lost by knowing more information.
Michael.
Michael.
This is the reason I said 1/6 smoothing you failed to show that one!!!
Last edited:
Ok let me put it another way, I use 1/6 smoothing for simplicity. It shows an overall of about what the room is doing and it is easy for others to read as well. I use no smoothing when the measurements are for myself. As for your comments on speaker placement, my speakers can not be moved they are corner horns and by design need to be into the corners. My LP can be moved but, I like the soundstage and imagining at 11' so I won't be moving it either. Now to the loss of energy you pointed out, I agree with that is why I am going to add a sub and work from there. All rooms are different and require different adjustments. It's not apples to apples when compairing rooms!!!
Read my post 17. I don't mind whatever resolution works best for your room. I am just giving you useful info to help you more specifically identify lost energy potentially caused by boundary interference. I can't tell from your measurement whether that's an issue in your room. There are additional things you can do as well. For example, Nyal says there's an excess phase or group delay plot you can do in REW to identify LF late arrivals. I had to deal with this issue myself. I can tell you from my experience that finer LF resolution can very much help you identify the boundary location and appropriately treat it. More resolution can also tell you whether you could benefit from a different speaker or seated position and which direction to start moving. There's nothing to be lost by knowing more information.
Michael.
Similar threads
- Replies
- 6
- Views
- 351
- Replies
- 1
- Views
- 634
| Steve Williams Site Founder | Site Owner | Administrator | Ron Resnick Site Owner | Administrator | Julian (The Fixer) Website Build | Marketing Managersing |


