The 24-Bit Delusion

jkeny

Industry Expert, Member Sponsor
Feb 9, 2012
3,374
42
383
Ireland
For quantization noise inside pure digital system need signal. For measurement of noise of apparatus - no.
Modulation of noise is non-linear distortions. I noted above «distortions + noise floor».
Quantisation noise is non-linear


What is mean careful?
Need exactly know that you want to get by measurement. Referring to any tests must be based on obvious benefits for each case.
If some enterprise use some kind of measurement, probably, it is necessary for their needs.

Let show simple example:

We send 2 sines (frequencies f1 and f2) to input non-linear device. At output we get oscillations kit with frequencies:

f1, f2, 2*f1, 3*f1, …, 2*f2, 3*f2, …, f1+f2, f1-f2, 2*f1-f2, 2*f2-f1, …

Such way we learn overload capabilities of of analog device (analog part of device). Because there is sophisticated non-linearity.
I don’t know, that may be measured for pure digital processing same way. Because it is simple calculated for each bit depth.

If add third sine, combinations of frequencies grow significantly.

Why need third sine? What new information we get?
Careful choice of frequencies involve mathematical calculation of a set of frequencies whose intermodulations will only arise between tones - there are ways of calculating such a set of frequencies - see here for instance
As I said AP have provided this sort of test on their analyser for a number of years.

What do we get with multitones? We get more real-world exercising of the device's ability to handle complex signals & a better tool to analyse it's non-linear behaviour.

It is also a measurement seen in the datasheet of non-audio DACs where SFDR (Spurious-free dynamic range) is onr of the measures of it's linearity - unfortunately SFDR is never seen in audio DAC datasheets, AFAIK
 

Yuri Korzunov

Member
Jul 30, 2015
138
0
16
Quantisation noise is non-linear

Yes. But without signal there will not noise.


Careful choice of frequencies involve mathematical calculation of a set of frequencies whose intermodulations will only arise between tones.
As I said AP have provided this sort of test on their analyser for a number of years.

What do we get with multitones? We get more real-world exercising of the device's ability to handle complex signals & a better tool to analyse it's non-linear behaviour.

It is also a measurement seen in the datasheet of non-audio DACs where SFDR (Spurious-free dynamic range) is the measure of it's linearity

For checking overload ability enough take 2 sines and check full spectrum step-by-step by frequency or in sweep mode.

This way slower than multitone. But it allow check overload ability for full frequency range in details.
It may be automated even.

But it is matter of personal choice.

Or methodics of measurements (that you see in datasheets) may be defined by industrial standard, as example.

As example, noise floor is average value of noise.
But for testing my algorithms I use harder parameter - maximal peak value of noise + distortions floor.

This parameter give worse value that noise floor value. But me need account aliases after resampling.

As test signal sweep sine is used primarily. I almost never use pure sines for checking resampling.

It allow me follow all aliases in output band.

For other processings may be used other signals.

Musical signal may be used for collect of statistics of overload of sigma-delta modulator.

For each case need individual suitable tool.
 

jkeny

Industry Expert, Member Sponsor
Feb 9, 2012
3,374
42
383
Ireland
I always find that noise gets little attention, particularly in digital audio. It's usually only mentioned in a very positive way comparing digital audio's noise superiority compared to analogue.

Often it is considered as just a fixed, unwavering noise floor, citing the mathematical conversion of bits to dB as a given & evidence of digital's automatic superiority. As many have pointed out here & elsewhere this is a mistaken & naive belief based on mathematical perfection - doesn't make much cognisance of component imperfections, PS implementations inter-device current leakage, self noise of chips, ground bounce noise & many other real-world considerations in audio What is interesting about noise is it's auditory perception or perception of its loudness

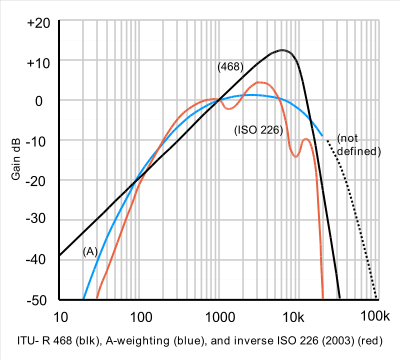
Not only that but the perception of noise is in a different category to other sound perceptions. For instance there are different hearing thresholds for sound than the usual Fletcher-Munson audibility curves we see cited for sound. Originally coming out of the BBC Research Department Report "The Assessment of Noise in Audio Frequency Circuits" led to the ITU-R 486 which defines the perceptual sensitivity to noise
noise curves.png

Hearing sensitivity to noise is different to sensitivity to other sound defined by Fletcher-Munson audibility curves. We are much more sensitive to noise by 12.2 dB centred at 6.3 kHz - this is the region in which we appear to be extremely sensitive to noise. In general we are more sensitive to noise than sound from about 1KHz to 20KHz

This is a psychoacoustic effect. The normal perception of loudness is related to sound pressure level (SPL), frequency content and duration of a sound. The human auditory system averages the effects of SPL over a 600–1000 ms interval. A sound of constant SPL will be perceived to increase in loudness as samples of duration 20, 50, 100, 200 ms are heard, up to a duration of about 1 second at which point the perception of loudness will stabilize. For sounds of duration greater than 1 second, the moment-by-moment perception of loudness will be related to the average loudness during the preceding 600–1000 ms (from Wiki). So our perception of the loudness of noise is based on the average loudness in the last 0.5 to 1 sec. As the type of background noise I am talking about is longer than 1 sec we are perceiving a running average of noise loudness

Another factor when considering any broadband signal, like noise is that our perception of loudness is also a total of the energy in each of the frequency bands (or barks) that our hearing seems to split the sound into - very similar to the bins FFTs split the signal into.This probably explains why we are 12dB more sensitive to this broadband signal - it’s the total of energy in the barks centered around 6KHz.

What hasn’t been researched or measured, AFAIK, is the absolute threshold of noise which affects our perception of timbre, sound stage & other psychoacoustic effects which many report on audio forums.
 

opus112

Well-Known Member
Feb 24, 2016
462
4
148
Zhejiang
Why need third sine? What new information we get?

Each additional sine increases the crest factor of the test signal. One reason that a single sine is inappropriate for testing audio kit is its crest factor is much lower than real music.
A high crest factor signal is exercising the low-level performance more, a test using it as stimulus is going to be more sensitive to low-level performance defects than a test with a
signal of lower crest factor.
 

Fiddle Faddle

Member
Aug 7, 2015
548
2
16
Australia
Further to my post from yesterday, I am attaching some PCM files and some graphs to illustrate what I was writing about - how a mathematically perfect 16 bit digital noise floor will change the perception of the sound of musical content that itself never even remotely exceeds 16 bits of dynamic range (at best).

I have chosen a recent vinyl LP transcription that I made at 24/44.1 PCM on my digital audio workstation. The analogue to digital converter is specified at around 21 bits dynamic range and the recording bit depth was set to 24 bits. The recording is the recent Analogue Productions reissue of LSC6065 - the Ernest Ansermet Ballet recording remastered by Bernie Grundman - this is around one minute and 15 second's worth from the opening of side 1 (Tchaikovsky Nutcracker Suite March).

I deliberately chose this recording because of the "appalling" amount of noise that it possesses as compared to modern digital standards. It was made in the late 1950s - so not only do we have a 1/4 inch analogue open reel without even the benefits conferred by Dolby "A" noise reduction (it did not come into use until 8 years later), but we have all the additional noise from the entire recording and vinyl remastering chain and of course, all the additional noise produced by my own turntable and phono-pre amp. That is a heck of a lot of noise - WAY below what 16 bit is capable of. Infact at a guess, in terms of digital theory, I could have recorded this at a bit depth of around 11 or 12 bits and it ought to sound exactly the same as the 24 bit recording.

Note: all files are packaged in a 24 bit container as 24/44.1 files, regardless of the actual bit depth.

File 01: The first file is the "raw" 24 bit, 44.1 KHz master file as directly recorded by the workstation. The file name is "file_01_24_441_original.wav".

File 02: The second file is the "raw" 24 bit, 44.1 KHz master file as above, but truncated to 16 bits. In other words, I simply discarded the last 8 bits. The file name is "file_02_24_441_truncated_to_16_bits.wav"

File 03: The third file contains nothing more than the truncated bits 17 to 24 of the original 24 bit file (effectively file_01 minus file_02), then amplified by 40 dB. As you can hear for yourself, it consists of nothing more than hiss the whole way through. There is absolutely nothing audible whatsoever to suggest the original recorded content extends beyond 16 bits (infact it likely does not extend much beyond 11 or 12 bits). The file name is "file_03_truncated_bits_17_to_24_amplified_by_40dB.wav".

File 04: The fourth file is the original 24 bit (file_01) dithered to 16 bits using the first of three mathematically perfect 16 bit noise shaping "curves" available with the PSP X-Dither module - a module that I favour over all other dithering modules after many months of extensive comparative listening tests (as I can always find a setting that comes closer to the 24 bit original than using any other dither module I have ever tried). The file name is "file_04_16_441_with_foa_16_bit_noise_curve.wav".

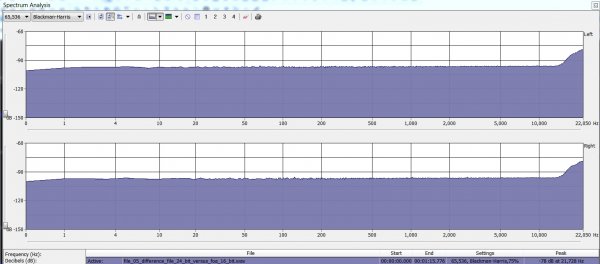
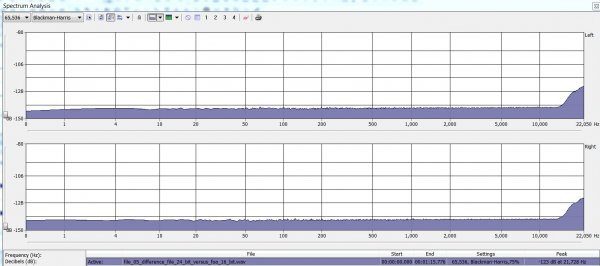
File 05: The fifth file is the "difference" file between file_01 and file_04. Effectively it is the added 16 bits of quantisation noise in file_04. The file name is "file_05_difference_file_24_bit_versus_foa_16_bit.wav". Below is a graph showing this actual added quantisation noise in file_04. To state the obvious, this noise is completely and utterly inaudible when the musical content is playing. And even if I had the dither set to operate on silent sections (I don't), you'd have to turn the volume up to absolutely deafening levels to hear it in a normal listening room:

file_05_difference.jpg


File 06: The sixth file is the original 24 bit (file_01) dithered to 16 bits using the second of three mathematically perfect 16 bit noise shaping "curves" available with the PSP X-Dither module. The file name is "file_06_16_441_with_hon_16_bit_noise_curve.wav".

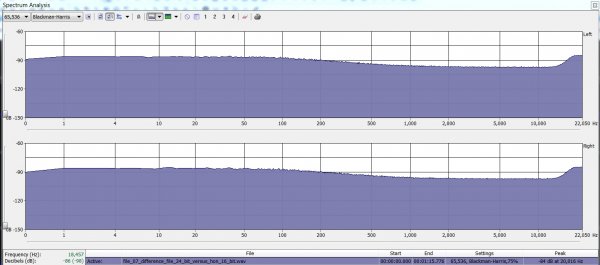
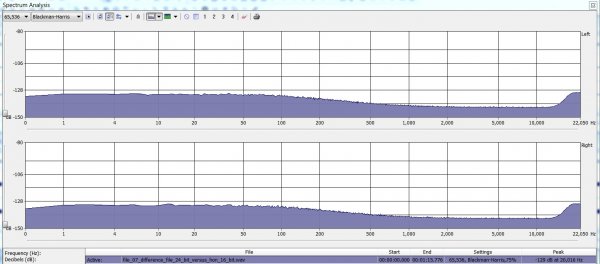
File 07: The seventh file is the "difference" file between file_01 and file_06. Effectively it is the added 16 bits of quantisation noise in file_06. The file name is "file_06_difference_file_24_bit_versus_hon_16_bit.wav". Below is a graph showing this actual added quantisation noise in file_06. As with the previous example, this noise is completely and utterly inaudible when the musical content is playing:

file_07_difference.jpg


File 08: The eighth file is the original 24 bit (file_01) dithered to 16 bits using the third of three mathematically perfect 16 bit noise shaping "curves" available with the PSP X-Dither module. The file name is "file_08_16_441_with_lob_16_bit_noise_curve.wav".

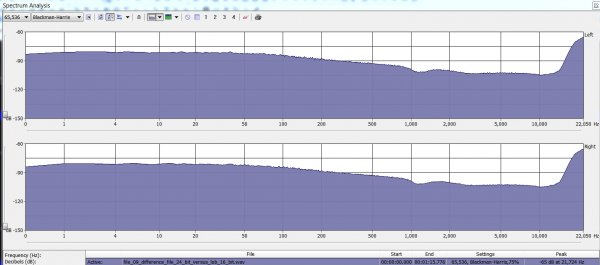
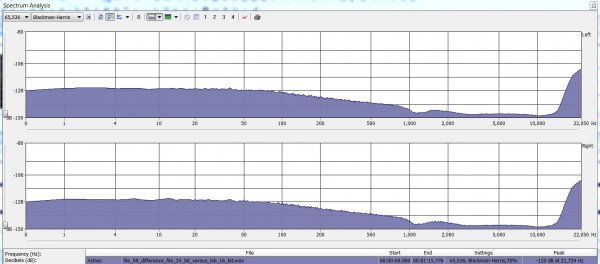
File 09: The ninth and final file is the "difference" file between file_01 and file_08. Effectively it is the added 16 bits of quantisation noise in file_08. The file name is "file_08_difference_file_24_bit_versus_lob_16_bit.wav". Below is a graph showing this actual added quantisation noise in file_08. As with the previous examples, this noise is completely and utterly inaudible when the musical content is playing:

file_09_difference.jpg


Below are the listening notes to guide you through the subjective listening tests - comparing the 24 bit original to the truncated version as well as the three different mathematically perfect 16 bit dithered files. Remember that according to digital audio textbook theory, all 5 of these files should sound identical because the original recorded source material would be lucky to exceed around 12 bits - far less than the "worst mathematically performing" of these files.

I won't make any comment about the original 24 bit file (file_01), since that is the "benchmark" file we are referring back to with each successive example. I would recommend that if you have difficulty hearing the differences amongst these files using normal A/B or ABXing, try instead listening to them in a normal listening situation over a period of a couple of weeks. As you become more and critical of what they actually sound like and much more acutely attuned to the nuances, you will almost certainly develop a preference for one (or even perhaps a couple) over the others. Of course, that should be the 24 bit one but in my experience, because noise shaping and dithering to 16 bits does change the sound during playback, sometimes the 16 bit versions can be subjectively preferable - or at least more "pleasant" (because the changed sound might subjectively "fix" or counteract a sonic weakness in the original or a sonic weakness in your own system or even your own hearing). That said, I've very rarely come across this sort of situation (I think I have seen it happen only a few times in over 220 analogue to digital conversions), but I thought I might mention it. If, for example, you had someone randomly label the files A, B, C and D, you might be surprised after a few weeks to find you like one of the 16 bit files better because the way in which they change the sound during playback synergises better with your system and your ears. To my ears, though, in this example the 24 bit example sounds the best and comes closest to the sound of the original analogue input. Of the 16 bit files, to my ears and on my system, the "FOA" version sounds the closest to the 24 bit version and is the one that I could happily with in long-term day to day listening (if I never had a 24 bit version of course). In other words, the shortcomings caused by the added quantisation noise might be noticeable in a direct comparison but when you have to live with the 16 bit version (for example, in the CD format) over the long term - weeks or months of familiarisation and critical listening - the FOA version is more listenable and the "damage" it causes to the 24 bit original is more benign. This version is - as a result - more sonically palatable and thus distracts less from one's listening pleasure.

Listening notes - truncated version (file_02)

First violins sound more metallic than in the 24 bit original. There is an artificial and edgy sheen to them that is absent in the 24 bit original. Soundstage is noticeably compressed compared to the 24 bit original - it sounds as if there are less string players in the first violin section even though the volume is of course precisely the same. The hall ambience is also compromised. In terms of pace, timing and coherency, however, I do not detect any especially significant difference between the two - it is mainly the steely edginess and compressed sense of 3D space that annoys me the most. But those two particular things annoy the heck out of me personally (especially as a retired amateur violinist) which is why I never truncate 24 bit files to 16 bit, even when recording from old analogue source material such as this.


Listening notes - FOA version (file_04)

Unlike the truncated version, this one retains much more of the original soundstage and the perception of each individual string player in first violin section, versus the compressed-sounding "player clumping" heard in the 24 bit version. The string tone is noticeably less edgy and steely and is more rounded compared to the truncated version - and for this reason it is far superior to mere truncation in my opinion. Where this version fails, however, is that the midrange gains some hardness and brittleness compared to the 24 bit version and there is a very small but perceptible loss of timing. Listen, for example, at between 16 and 19 seconds - the 24 bit version is smoother sounding and does not possess the brittleness of this 16 bit FOA version.


Listening notes - HON version (file_06)

To my ears, this version retains virtually all the timing of the 24 bit original. The compromises in this respect are exceptionally small and demand very critical listening. The price to pay here, however, is that the soundstage is not quite as good as with the FOA version above and that the midrange is noticeably spot-lit in the overall mix compared to the 24 bit original. Infact, if I did not know I had done nothing more than change the 16 bit noise shaping curve, I would have said someone had put a transistorised analogue equaliser to it and slightly emphasised the upper midrange.


Listening notes - LOB version (file_08)

This version has to my ears a fantastically clear and detailed midrange. You get virtually all the sense of the performing space and ambience of the original 24 bit version in the critical midrange where our ears are the most sensitive. But based on comparing the subjective listening notes to the graphs above, perhaps this should not be so surprising, since in this example, the signal to noise ratio is superb (for 16 bits) between 1,200 Hz and 12 KHz. And between 2,300 Hz and 12 KHz the signal to noise ratio exceeds the capability of the original analogue to digital converter used to make the recording in the first place. No wonder the midrange in this version sounds closest of all four to the 24 bit original. But there is a price to pay for this: The top end, whilst still significantly smoother sounding (and thus far more tolerable) than the truncated version (file_01), is emphasised in the overall mix over the 24 bit version. And the timbre of the violins also sounds thinned out compared to the 24 bit version. Compare, also, for the example, the thicker, rounder and woodier sounding timbre of the first violins in the FOA version versus the thinner timbre in this version. Furthermore, the bass is not quite as clear as that of the 24 bit original. Listen to the cellos playing the rising scale between 21 and 25 seconds for example - the 24 bit original possesses more clarity and "bite".

All the files can be downloaded as a "zip" archive from here:

https://www.sendspace.com/file/bhbkom
 
Last edited:

jkeny

Industry Expert, Member Sponsor
Feb 9, 2012
3,374
42
383
Ireland
Thanks FF - a very useful exercise & will take a listen
Just a note, the process gain in your displayed FFT is about 45dB based on the 65536 bin length (no of bins) - so all 'noise floors' shown in the plots should be raised by around 45dB to give a more realistic noise floor figure
So, for instance, in your first plot the 'noise floor' of about -143dB is adjusted to -98dB
 

Fiddle Faddle

Member
Aug 7, 2015
548
2
16
Australia
Just a note, the process gain in your displayed FFT is about 45dB based on the 65536 bin length (no of bins) - so all 'noise floors' shown in the plots should be raised by around 45dB to give a more realistic noise floor figure
So, for instance, in your first plot the 'noise floor' of about -143dB is adjusted to -98dB

OK, Do you know what parameters I should use? I just used the Sound Forge Pro spectral analysis defaults. Or otherwise are you able to do them and re-post them based on the files included in the zip archive? (files 5, 7 and 9). I could just raise the volume but I am not sure if I would produce something "accurate".

I can certainly raise the volume such that the lowest part of each plot hits around -98 dBFS if that would produce something more meaningful?
 

Fiddle Faddle

Member
Aug 7, 2015
548
2
16
Australia
I have just re-done them raising the floor by the 45 dB you mentioned. And actually by doing that, the highest part of the noise floor correlates to the dB reading on the channel meters during actual playback. I still do not know if it is right or not so if not I will leave it to the graph experts as they have the files in the archive. The graphs below are in the same order as my original post (so FOA, HON and LOB).

I need to learn about all this "bin" stuff and what the parameters all exactly mean. As someone who deals with subjective listening this sort of stuff isn't my strength at all!

So now looking at the LOB plot, for example, that would seem to suggest that for me personally, my own listening skills combined with my middle of the road system are running out of "critical puff" at around an effective noise floor of 18 bits. I say that since I feel the midrange of the file processed using the LOB curve was almost as good as that of the 24 bit file, but it wasn't audibly identical either.

Also, do you know if there is any tutorial about all this bin stuff, etc on the internet? I was frustrated a couple of years ago but could never find any source to explain it all to me. So I have always been frustrated - there being no correlation between the dB meters and the plots until you explained (at least some of it) to me. But even your quick explanation has been a big help to me - thanks!


foa.jpg

hon.jpg

lob.jpg
 
Last edited:

jkeny

Industry Expert, Member Sponsor
Feb 9, 2012
3,374
42
383
Ireland
What you've done is raise the volume by 45dB & replotted using the same FFT settings - the same number of FFT bins, 65536 - it simply just means that the actual noise floor is now at a higher volume - for instance in the last plot your actual noise floor is still 45dB higher (due to the process gain in using 65536 FFT bins) than the plot shows - so it's really at -82dB(from eyballing the plot) +45dB (process gain) = -37dB.

There is no correct setting - usually using a high number of FFT bins allows stuff buried to be extracted from the noise - it's a bit like taking a photo in bad light, a longer exposure is needed in order to capture details. But increasing the number of FFT bins (note this is not oversampling as Amir erroneously claimed) lowers the plotted 'grass' in the plots - that's why the signal details can be extracted but this grass is NOT the noise floor it's a mathematically derived plot of the noise floor & needs to be adjusted by the process gain which is normally = 10*log(M/2) where M is the number of bins.

Bins are just a band of equal frequencies into which the signal is analysed. If we split a broadband signal, like noise into freq bands of 10Hz in each band & analyse the energy in each band we get a certain value - if we then split each of those bands in half so they are now 5Hz wide & analyse the energy in each band, it will be less than the energy in the 10Hz bands. The FFT plots are plotting the energy in each of these bands (FFT bins) & showing it as the "grass" at the bottom of the plot from which the signals emerge - it's easy to think that this is the noise floor as it is presented in this way but to derive the correct noise floor value we need to correct for the number of bins into which the broadband signal has been divided.
 

Yuri Korzunov

Member
Jul 30, 2015
138
0
16
Each additional sine increases the crest factor of the test signal. One reason that a single sine is inappropriate for testing audio kit is its crest factor is much lower than real music.
A high crest factor signal is exercising the low-level performance more, a test using it as stimulus is going to be more sensitive to low-level performance defects than a test with a
signal of lower crest factor.

Real music is stochastical process. Independent number of test sines (upper 2) we can't cover all cases.
I suppose, we can't predict what percent of the cases covered by N sines even.
So it lead to complicated analyzis only. Without practical sense.
 

jkeny

Industry Expert, Member Sponsor
Feb 9, 2012
3,374
42
383
Ireland
Real music is stochastical process. Independent number of test sines (upper 2) we can't cover all cases.
I suppose, we can't predict what percent of the cases covered by N sines even.
So it lead to complicated analyzis only. Without priactical sense.

Your answer doesn't make sense to me - you were given reasons why multiple signals represent a more revealing test signal but you ignore them.
 

jkeny

Industry Expert, Member Sponsor
Feb 9, 2012
3,374
42
383
Ireland
We talks about measurements. There all in numbers. Let describe "more revealing" term in numbers, please.

No, you talk about measurements - I want to relate auditory perception to measurements, not just talk about measurements in isolation from perception
If measurements using a multitone test signal represents a better correlation to what is heard then I'm in favour of using these types of signals & analysis - maybe you are not?
You have been given enough references & reasoning to suggest multitone testing gets us a more revealing picture of what might be happening when playing music but you seem to reject this - nothing more to be said, I guess.
 

Yuri Korzunov

Member
Jul 30, 2015
138
0
16
No, you talk about measurements - I want to relate auditory perception to measurements, not just talk about measurements in isolation from perception
If measurements using a multitone test signal represents a better correlation to what is heard then I'm in favour of using these types of signals & analysis - maybe you are not?
You have been given enough references & reasoning to suggest multitone testing gets us a more revealing picture of what might be happening when playing music but you seem to reject this - nothing more to be said, I guess.

Ok. You used multitone for testing.

What conclusions about this test for perception you may officially claim as vendor?
 

jkeny

Industry Expert, Member Sponsor
Feb 9, 2012
3,374
42
383
Ireland
Ok. You used multitone for testing.

What conclusions about this test for perception you may officially claim as vendor?

Look, I gave you many references to look into the advantages of multitone testing - did you read any of them?
I told you that AP have included it in their spectrum analysers for many years now - did you look into any of this?
Maybe you need some authority figure to tell you (although Scott Wurcer, whom I referenced earlier should suffice - he's the chief design engineer at Analog Devices)
From AP's technical support manager - not difficult to find if one is actually interested in the topic rather than trying to win a debate on a forum https://www.ap.com/technical-library/using-multitones-in-audio-test/
"As the name implies, a multitone stimulus signal consists of multiple sine waves (or tones) at different frequencies combined together. Any number of tones can be used, but 3 to 30 tones spaced logarithmically across the audio band is typical. This feature alone offers several advantages over traditional single tone testing:

  1. It allows the performance of a DUT to be evaluated over a range of frequencies with a single measurement.
  2. The characteristics of a multitone waveform (e.g., spectral content, histogram, crest factor, etc.) give it a much closer resemblance to typical audio program material like music or speech, than a single sine wave.
  3. Multitone distortion is generally better at detecting real-world problems involving clock jitter and sample rate conversion than traditional THD+N measurements.
 

Yuri Korzunov

Member
Jul 30, 2015
138
0
16
Look, I gave you many references to look into the advantages of multitone testing - did you read any of them?
I told you that AP have included it in their spectrum analysers for many years now - did you look into any of this?
From AP's technical support manager - not difficult to find if one is actually interested in the topic rather than trying to win a debate on a forum https://www.ap.com/technical-library/using-multitones-in-audio-test/
"As the name implies, a multitone stimulus signal consists of multiple sine waves (or tones) at different frequencies combined together. Any number of tones can be used, but 3 to 30 tones spaced logarithmically across the audio band is typical. This feature alone offers several advantages over traditional single tone testing:

  1. It allows the performance of a DUT to be evaluated over a range of frequencies with a single measurement.
  2. The characteristics of a multitone waveform (e.g., spectral content, histogram, crest factor, etc.) give it a much closer resemblance to typical audio program material like music or speech, than a single sine wave.
  3. Multitone distortion is generally better at detecting real-world problems involving clock jitter and sample rate conversion than traditional THD+N measurements.


1. Multitone maybe have sense for a hardware devices that work in real-time.
As example, for simultaneous estimation at several frequencies, measurement time economy, etc.
It is a clear reasons.
Same way may be used white noise for estimation of amplitude-frequency response.

But using multitones is not the best for all cases around.


2. As example, software sample rate conversion fine tested via sweep sine.
We can see all aliases in full work band at time-spectral diagramm (waterfall).

If aliases higher than -100 dB it may be one class of resamples.
If aliases lower than -170 dB it may be other class of resamples.
These things may be officially claimed and re-checked.

Sweep sine check every frequency. Multitone - only several ferquencies.
Multitone will mixed with aliases. Picture will more confused.

Therefore, I suppose, that sweep sine give more information and easier in analysis for checking of resamplers, than multitone.

Look for resampler comparison here, please: http://src.infinitewave.ca/
 

jkeny

Industry Expert, Member Sponsor
Feb 9, 2012
3,374
42
383
Ireland
1. Multitone maybe have sense for a hardware devices that work in real-time.
As example, for simultaneous estimation at several frequencies, measurement time economy, etc.
It is a clear reasons.
Same way may be used white noise for estimation of amplitude-frequency response.

But using multitones is not the best for all cases around.


2. As example, software sample rate conversion fine tested via sweep sine.
We can see all aliases in full work band at time-spectral diagramm (waterfall).

If aliases higher than -100 dB it may be one class of resamples.
If aliases lower than -170 dB it may be other class of resamples.
These things may be officially claimed and re-checked.

Sweep sine check every frequency. Multitone - only several ferquencies.
Multitone will mixed with aliases. Picture will more confused.

Therefore, I suppose, that sweep sine give more information and easier in analysis for checking of resamplers, than multitone.

Look for resampler comparison here, please: http://src.infinitewave.ca/

You are really making a lot of statements about multitone testing "Multitone will mixed with aliases. Picture will more confused." Answers were already given to you on this when you asked the same question before
I don't know if it's your use of English or your lack of understanding of the answers already given?
Please inform yourself about multitone testing & how the frequencies are chosen before making further comments on something you seem to know little about.
 

Yuri Korzunov

Member
Jul 30, 2015
138
0
16
No, you talk about measurements - I want to relate auditory perception to measurements, not just talk about measurements in isolation from perception
If measurements using a multitone test signal represents a better correlation to what is heard then I'm in favour of using these types of signals & analysis - maybe you are not?
You have been given enough references & reasoning to suggest multitone testing gets us a more revealing picture of what might be happening when playing music but you seem to reject this - nothing more to be said, I guess.

Ok. I agree. Multitones are cool ;)
 

Fiddle Faddle

Member
Aug 7, 2015
548
2
16
Australia
What you've done is raise the volume by 45dB & replotted using the same FFT settings - the same number of FFT bins, 65536 - it simply just means that the actual noise floor is now at a higher volume - for instance in the last plot your actual noise floor is still 45dB higher (due to the process gain in using 65536 FFT bins) than the plot shows - so it's really at -82dB(from eyballing the plot) +45dB (process gain) = -37dB.

There is no correct setting - usually using a high number of FFT bins allows stuff buried to be extracted from the noise - it's a bit like taking a photo in bad light, a longer exposure is needed in order to capture details. But increasing the number of FFT bins (note this is not oversampling as Amir erroneously claimed) lowers the plotted 'grass' in the plots - that's why the signal details can be extracted but this grass is NOT the noise floor it's a mathematically derived plot of the noise floor & needs to be adjusted by the process gain which is normally = 10*log(M/2) where M is the number of bins.

Bins are just a band of equal frequencies into which the signal is analysed. If we split a broadband signal, like noise into freq bands of 10Hz in each band & analyse the energy in each band we get a certain value - if we then split each of those bands in half so they are now 5Hz wide & analyse the energy in each band, it will be less than the energy in the 10Hz bands. The FFT plots are plotting the energy in each of these bands (FFT bins) & showing it as the "grass" at the bottom of the plot from which the signals emerge - it's easy to think that this is the noise floor as it is presented in this way but to derive the correct noise floor value we need to correct for the number of bins into which the broadband signal has been divided.

Thanks. I learn a lot from all of your posts. When I get a chance I will do some further experimentation, especially comparing the plots with different bin settings. To a complete measurement novice like me, I naively thought you could simply accurately plot a noise floor and what you see would be "perfect". But the camera analogy is great. It' actually the first time I've come across any explanation of it that I am able to understand!
 

jkeny

Industry Expert, Member Sponsor
Feb 9, 2012
3,374
42
383
Ireland
Thanks. I learn a lot from all of your posts. When I get a chance I will do some further experimentation, especially comparing the plots with different bin settings. To a complete measurement novice like me, I naively thought you could simply accurately plot a noise floor and what you see would be "perfect". But the camera analogy is great. It' actually the first time I've come across any explanation of it that I am able to understand!

Thanks FF
 

About us

  • What’s Best Forum is THE forum for high end audio, product reviews, advice and sharing experiences on the best of everything else. This is THE place where audiophiles and audio companies discuss vintage, contemporary and new audio products, music servers, music streamers, computer audio, digital-to-analog converters, turntables, phono stages, cartridges, reel-to-reel tape machines, speakers, headphones and tube and solid-state amplification. Founded in 2010 What’s Best Forum invites intelligent and courteous people of all interests and backgrounds to describe and discuss the best of everything. From beginners to life-long hobbyists to industry professionals, we enjoy learning about new things and meeting new people, and participating in spirited debates.

Quick Navigation

User Menu

Steve Williams
Site Founder | Site Owner | Administrator
Ron Resnick
Site Co-Owner | Administrator
Julian (The Fixer)
Website Build | Marketing Managersing