This post provides a quick comparison of how a distortion percentage relates to dynamic range in dB. That is, if an amplifier has 1% distortion, what does that mean? How soft (or loud) is 1%?
Figure 1 shows a 1 kHz voltage signal with 1% second harmonic distortion (HD2) added. The spectral analysis (FFT, fast Fourier transform) shows the second harmonic at 40 dB below (-40 dB) the (0 dB) signal. So, 1% distortion is 40 dB below the signal level. Recall that dB = 20log(x), 1% is 1/100 = 0.01, and 20log(0.01) = -40 dB. Aside: Power goes as 10log(x), so 1% distortion in power (Watts) is only -20 dB. In SPL (dB/W), 20 dB is about the difference between say a pretty loud sound (80 dB) and a normal conversational volume (60 dB). Since we are in voltage (maybe a preamplifier output before the power amp), 40 dB takes you from that loud sound down to a fairly quiet room, say a library.
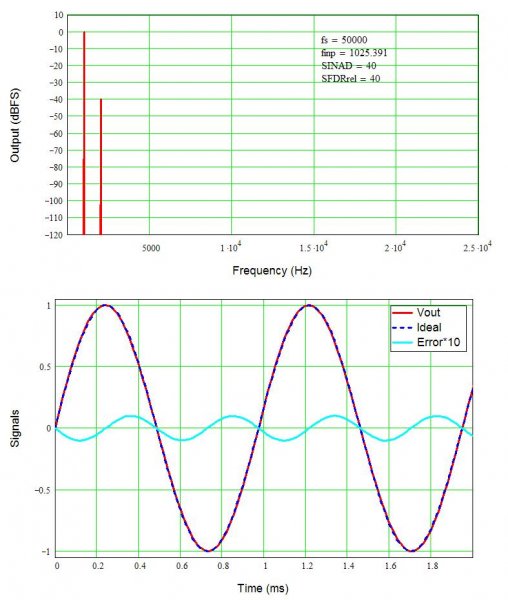
The lower plot shows an ideal sine wave, the signal with 1% distortion, and the difference (error) signal multiplied by 10 to make it easier to see. By eye, I cannot see any difference in the ideal input signal and output with 1% distortion (Vout). Because the error is purely second harmonic distortion, notice there are twice as many cycles in the error as in the input signal.
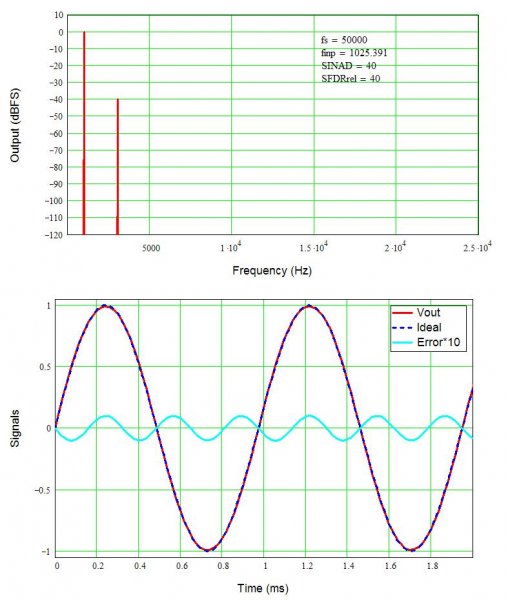
The figure below shows the same 1% distortion but now it is third harmonic distortion (HD3). The HD3 spur is -40 dB, but notice there are now three error cycles for each full cycle (0-up-0-down-o) of the signal. And again, I can’t see anything by eye (maybe you can).
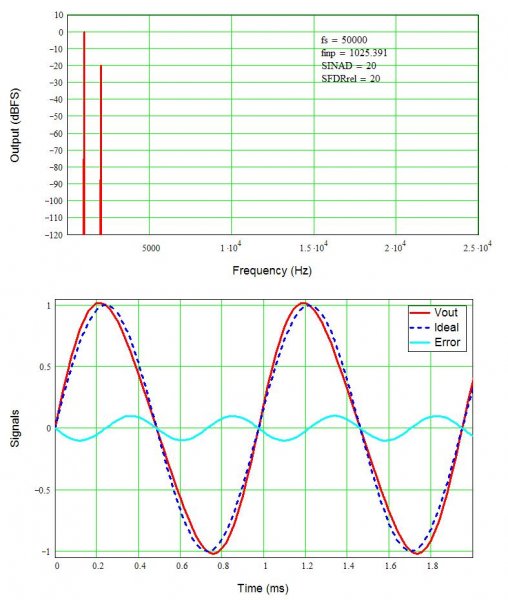
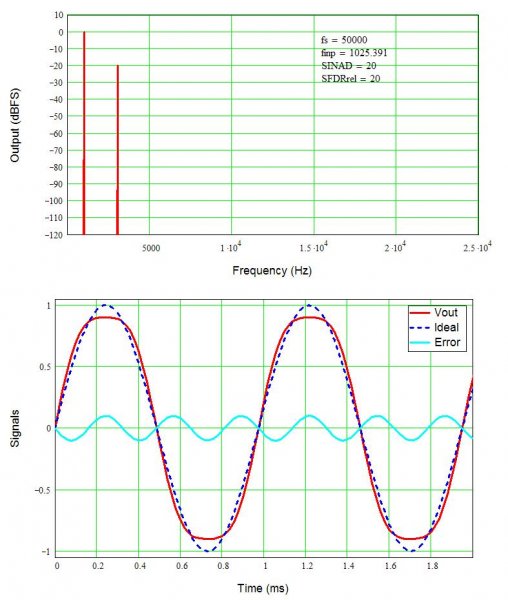
Just for grins, and for something to see, the following two pictures show 10% HD2 and HD3. As expected the harmonic terms are now only 20 dB below the signal. What is interesting is how the high level of distortion changes the look of the waveforms. Second harmonic distortion does not change the picture too much, but third harmonic distortion causes the peaks to flatten, sort of like a soft square wave. Even harmonics tend to sound more pleasant than odd harmonics, adding a bit of edge to the sound while odd harmonics create a raspy buzz.
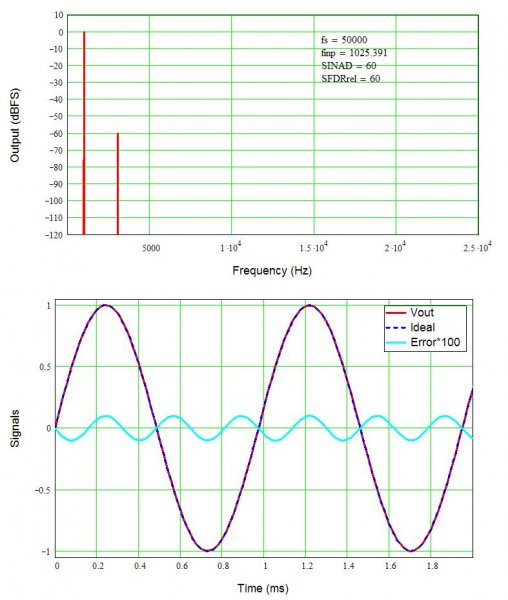
Last is a figure showing 0.1% HD3, with a spur 60 dB below the signal. A factor of ten in distortion changes the level by 20 dB (in voltage; a 10x change in power is 10 dB).
Finally, here’s a table showing the relationship among distortion in percent and dB in voltage (or current) and power. The dominant source of distortion in most systems is the speakers, which often run 1% or more in the midrange even for good ones, and 10% or more for large low-frequency signals. Amplifiers usually run in the 0.1 – 1% range, and preamps often 0.01% or better.
Distortion (%) Relative Voltage Level (dB) Relative Power Level (dB)
0.01 -80 -40
0.05 -66 -33
0.10 -60 -30
0.50 -46 -23
1.00 -40 -20
5.00 -26 -13
10.0 -20 -10
<Could not figure out how to clean up the table alignment, sorry!>
Hopefully this will help relate those distortion percentages to the dB specifications used for SNR, SPL, and so forth.
Figure 1 shows a 1 kHz voltage signal with 1% second harmonic distortion (HD2) added. The spectral analysis (FFT, fast Fourier transform) shows the second harmonic at 40 dB below (-40 dB) the (0 dB) signal. So, 1% distortion is 40 dB below the signal level. Recall that dB = 20log(x), 1% is 1/100 = 0.01, and 20log(0.01) = -40 dB. Aside: Power goes as 10log(x), so 1% distortion in power (Watts) is only -20 dB. In SPL (dB/W), 20 dB is about the difference between say a pretty loud sound (80 dB) and a normal conversational volume (60 dB). Since we are in voltage (maybe a preamplifier output before the power amp), 40 dB takes you from that loud sound down to a fairly quiet room, say a library.

The lower plot shows an ideal sine wave, the signal with 1% distortion, and the difference (error) signal multiplied by 10 to make it easier to see. By eye, I cannot see any difference in the ideal input signal and output with 1% distortion (Vout). Because the error is purely second harmonic distortion, notice there are twice as many cycles in the error as in the input signal.
The figure below shows the same 1% distortion but now it is third harmonic distortion (HD3). The HD3 spur is -40 dB, but notice there are now three error cycles for each full cycle (0-up-0-down-o) of the signal. And again, I can’t see anything by eye (maybe you can).

Just for grins, and for something to see, the following two pictures show 10% HD2 and HD3. As expected the harmonic terms are now only 20 dB below the signal. What is interesting is how the high level of distortion changes the look of the waveforms. Second harmonic distortion does not change the picture too much, but third harmonic distortion causes the peaks to flatten, sort of like a soft square wave. Even harmonics tend to sound more pleasant than odd harmonics, adding a bit of edge to the sound while odd harmonics create a raspy buzz.


Last is a figure showing 0.1% HD3, with a spur 60 dB below the signal. A factor of ten in distortion changes the level by 20 dB (in voltage; a 10x change in power is 10 dB).

Finally, here’s a table showing the relationship among distortion in percent and dB in voltage (or current) and power. The dominant source of distortion in most systems is the speakers, which often run 1% or more in the midrange even for good ones, and 10% or more for large low-frequency signals. Amplifiers usually run in the 0.1 – 1% range, and preamps often 0.01% or better.
Distortion (%) Relative Voltage Level (dB) Relative Power Level (dB)
0.01 -80 -40
0.05 -66 -33
0.10 -60 -30
0.50 -46 -23
1.00 -40 -20
5.00 -26 -13
10.0 -20 -10
<Could not figure out how to clean up the table alignment, sorry!>
Hopefully this will help relate those distortion percentages to the dB specifications used for SNR, SPL, and so forth.


