Terry, again I am not trying to make this article about how to fix the bass. The article is to demonstrate mathematical principals that are in play. These principals are disputed by Ethan with the conclusion that only acoustic products are proper solutions. That just isn't so in this region. So no, in here and now, I am not trying to convince you of anything but the core mathematics of the problem. If you agree that by changing frequency response I also correct the time domain, then we are done.
We are done?

Nope, not completely.
As you should know by now, I am completely on *your* side when it some to the utility of dsp solutions. Also, I get that it is not a treatise on bass correction. Firstly, regarding Ethan, perhaps it was just plain old 'bad luck' he chose to test the theory with audessy. That Sean Olive too had similarly poor results seems to strengthen that thought. IF that lies somehow at the bottom of this, then Ethan is making the mistake of extrapolating unfairly from a limited test base.
Oh, I should also add not for a second do I dispute the science here. (what seems to be the audio equivalent of the uncertainty principle) I think it only fair to point out that all this applies strictly to minimum phase conditions. The question then becomes 'are there NON minimum phase conditions that we can come across in everyday listening'? If so (and I hinted at this question earlier) then under those circumstances 'mere' eq won't fully solve the problem. I guess it remains to be seen if acoustic solutions will solve it, but that's another ball game.
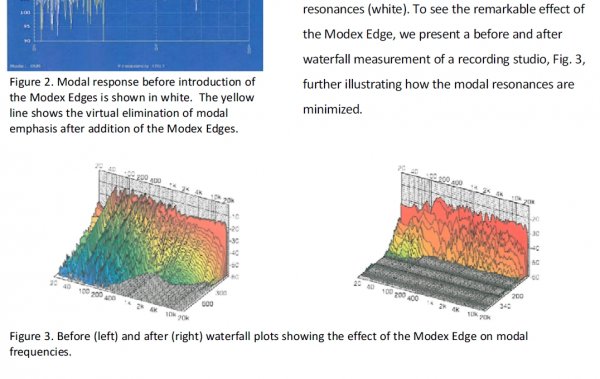
Hopefully my quoting will isolate the right graphs!
Ok, good enough. (hmm, the bolded text seems to be embedded with the graphs, oh well)
TBH, I don't really see anything that is definitively 'reduction in ringing' other than your say so based on others interpretation of these graphs. For starters, what would be a definition of ringing we can all agree upon?
I initially though these might have been simple impulse graphs, tried running a few just before yet I did not get anything that remotely resembled them, so can't chase that further sadly.
Still, at least one way I can see those 'time' graphs is the following. We have amplitude vs time. To me, I don't really see any change in time. All the peaks and valleys exactly co-incide, all we see is a reduction in the corresponding magnitude at those times. That is fully in keeping with the knowledge that we have reduced those amplitude with eq.
Somewhere recently I recall someone using a pendulum as an analogy? Might have been this thread. Anyways, keeping with that analogy what I see is a lesser time to come to a stop simply because it had a lesser initial impetus. the basic parameters of the pendulum remain unchanged (from very vague memory it is only dependent on weight and length???) Similarly here, we have not 'changed' the room parameters, we have simply given the bob less of a push.
I mean if 'ringing ' is a
room function, we can only really change it by changing the room no?
This and the fact that time and frequency are at war with each other with respect to resolution are the central points. I think the case is made clearly here for what is right and if we agree, then Ethan's notion that such processing is not as good because it only deals with half the universe creates the wrong impression of the technology.
Yeah, for sure. But we also have to be wary about creating yet another 'false' notion?
Beyond that, if you separate your bass and allocate it to multiple subwoofers, and optimize their operation, you can get remarkably flat response even without acoustic products aimed at bass frequencies. This is not to say you should not use acoustic products. But that you are better off starting with those techniques and then see what is left over to be corrected. If you cannot deploy DSP or multiple subs then acoustic products are your only means.
"I canna argue with that capt'n.'